Table of Contents
Internal heat gains in relation to living area
New version of the standard assumptions for internal heat gains in residential buildings in the PHPP 9
At the 18th Passive House Conference in Aachen (Germany), Nick Grant and Alan Clarke presented a concept for new standard values for internal heat gains (IHG) in residential buildings [Grant 2014]. For the UK they ascertained that higher occupancy rates on average prevailed in smaller dwelling units (DU), as a result of which not only body heat from occupants but also the heat dissipated by electrical applications – which is in part linked to the number of occupants – increases in relation to the area.
Proceeding from these considerations, an approach for occupancy rates and internal heat gains was devised below which will be used as a standard value for residential buildings in the PHPP 9 (2015). The calculations were performed using the PHPP 8; however, some additions have been made, e.g. taking into account of cold and hot water separately. Utilisation factors and frequencies have been taken from the PHPP worksheet IHG.
First it must be noted that the fluctuation range of occupancy and IHG between different dwellings is considerable even with identical dwelling sizes. As a rule, the intensity of usage will also change during the service life of the building, therefore these are only estimated average values for the model shown here, which may be higher or lower in individual cases. Nevertheless, such standard values are crucial for practical planning. An additional review using other approaches (e.g. for specific known occupancy, equipment etc.) is naturally always possible.
1 Occupancy in relation to living area
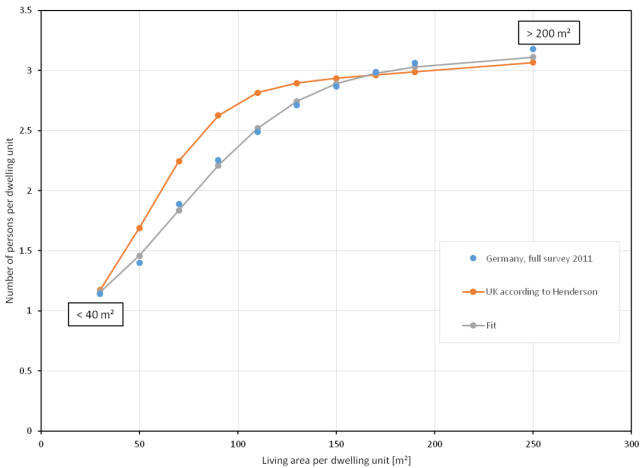
The average occupancy of a dwelling depends on the size of the dwelling. For Germany, data from [Zensus 2011] is available regarding this, from which the average value for the number of persons per dwelling unit (more exactly: the number of persons who inhabit this dwelling; temporary absence will be taken into account later on) can be calculated as a function of the dwelling size. An excellent fit of this data is achieved with a function of the form
$$
n=1+a(1-e^{-b(A-c)^2})+d\cdot A
$$
where
n: number of persons per DU
A: living area per DU
a,b,c,d: best-fit parameters
The following chart shows this dependence in comparison with a best fit of similar data from the UK according to Henderson, as given in [Grant 2014]. The average occupancy density in the UK is up to 20 % higher in smaller dwelling units; with large dwelling units, this difference disappears. The differences between Germany and the UK lie in the order of magnitude of the usual statistical accuracies. Comparable statistical data from other countries was not available, unfortunately. Below, as well as in the PHPP 9, we will use the data from Germany.
2 Actual electricity consumption depending on household size
The energy agency in the German State of North Rhine-Westphalia (Energieagentur NRW) estimated the distribution of the electricity consumption in 300 000 homes based on detailed information provided on a website by the occupants themselves [NRW 2011]. Although these results are not representative, assessment was interesting due to the large sample and the high degree of detail. The measurements showed the separate electricity consumers depending on the number of persons per household. These are shown in the following chart broken down according to households with and without hot water generation. A straight line can be fitted to the data in order to obtain the share of the consumption depending on the household and on the number of persons.
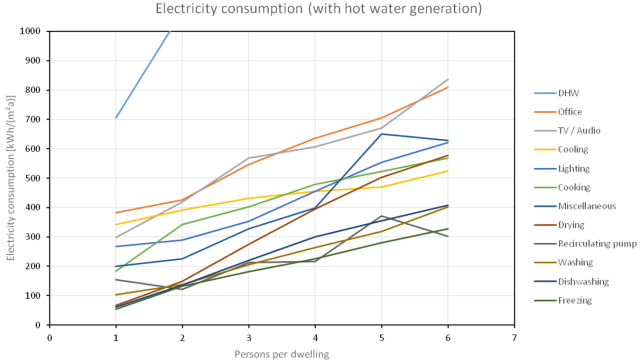 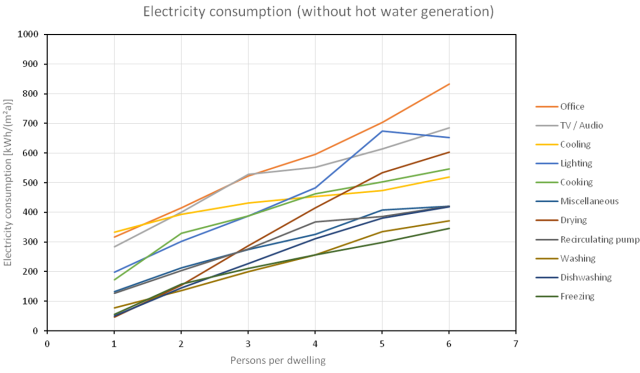 |
| Figure 2: Electricity consumption as a function of the number of persons in a household based on [NRW 2011] |
From this data, it is thus possible to derive the individual amounts according to the systematology in the PHPP. This is of significance because it is not possible to count the entire electricity consumption as internal heat gains; the varying availability of the dissipated heat depending on the use must be taken into account. If this is done and the results are added to the typical occupancy density for Germany from Section 2, then the following correlation between dwelling unit size and internal heat gains will result for this sample:
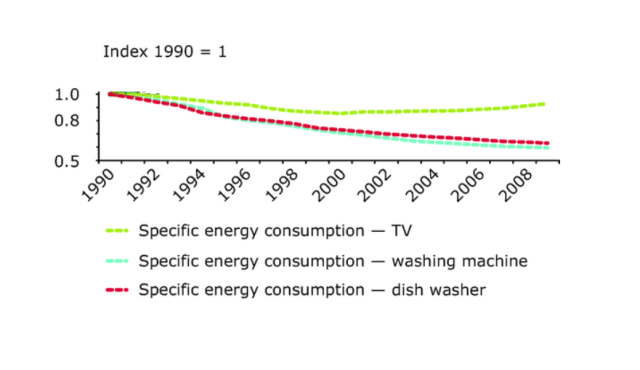
The PHI points out that it is not permissible at all to use such high values for the planning of Passive Houses. There are several reasons for this: in the first place, attention is and must be given to a high level of efficiency of electricity applications particularly in Passive House buildings. In terms of planning, it is easy to influence the auxiliary electricity demand for example, which is still quite high in this sample [NRW 2011]. There is a significant improvement especially in the efficiency of household appliances and lighting currently, as is apparent from Figure 4. On account of regular replacement of older appliances, in the coming years further technological development and ecodesign guidelines of the EU will decrease power consumption in households even further. The data from [NRW 2011], which depicts the existing stock of appliances in the preceding years therefore only allows limited statements to be made about electricity consumption during the lifetime of the building – but exactly this is relevant for dimensioning and assessment.
Approaches for individual contributions to internal heat gains of efficient electrical appliances in Passive Houses will therefore be inferred below, from which the standard values for IHG for residential use will result. However, the high values calculated in Figure 3 suggest that sensitivity analyses with increased IHG should be performed especially for small dwellings.
3 Approach for household appliances
Of the household appliances in the list below, one appliance was assumed for each dwelling unit. The best appliances available on the market in terms of energy efficiency were chosen based on [Spargeräte 2014] and [Ecotopten 2014]. In the cases indicated with a *, the stated consumption was multiplied by 1.5 in order to compensate for standby losses and potential optimisation of the appliances to the test cycle (testing in the eco-programme, normal operation with the automatic programme, etc.).
- Dishwasher with cold water connection, A+++, 0.69* kWh per rinse cycle
- Washing machine with cold water connection, A+++, 0.66* kWh per wash cycle
- Heat pump dryer, 1.0 kWh per use with 7 kg
- Fridge-freezer, A+++, table-top (120 l) and standalone (280 l) identical consumption, 150 kWh/a
- Induction cooker, 0.2 kWh per use
4 Approach for other electricity applications
Here it must be considered that in the last few years, the electricity consumption especially of consumer electronics and computers has increased compared with the original figures used in the PHPP. However, at the same time we also anticipate future improvements in efficiency. In the PHPP the figure for electronics will be increased from 80 to 250 W per person at 550 full load hours per year. The amount depending on the number of occupants will still remain below that in the data from NRW (where it is 340 W/P at 550h/a). The occupant-related amount in the data from NRW of a constant 56 W per dwelling unit will not be taken into account. This amount comprises standby losses for telephones, routers etc. It is expected that this amount will become considerably smaller in the next few years on account of regulatory requirements, especially since the typical standby losses of power supply units currently offered on the market as standard are already significantly less than 1 W and legal requirements already apply for many devices. Thus the following heat gains will arise per person:
- Lighting using 100% energy saving lamps (fluorescent lamps as well as LED lamps are possible; older measurements still include a large proportion of incandescent lamps)
- Electronics etc. 250 W during 550 hours per person per year
- Small devices 50 kWh per person per year (specified value in the PHPP as before)
5 Auxiliary electricity
Auxiliary electricity consumptions depend strongly on the systems used. For the standard case, underfloor heating (optimised for electrical supply with an efficient heat pump, may also allow simple daytime storage of renewable energy) in combination with an optimised hot water circulating system (hot water storage tank for reducing the load on the grid, 60 °C) is assumed. This results in the following sources of released heat from auxiliary electricity uses:
- Heating circulating pump, in a Passive House building 10 W/100 m² are sufficient in case of hydraulic balancing even with low temperature differences. It is assumed that a controllable pump is used.
- Hot water circulation 5 W per dwelling unit, operating time 24 h/d
- Hot water storage tank charging pump 1 W per person, operating time 24 h/d (the heat pump operates continuously, but the waste heat from the storage tank charging pump mostly benefits the hot water)
- Primary pumps and fans of the heat pump are not accounted as IHG, as waste heat from these is released into the outdoor air.
- A solar thermal system is not considered
- The electricity consumption of the ventilation system is already taken into account in the heat recovery efficiency, so counting this again as IHG would not be correct.
6 Persons
Sensible (body) heat per person 80 W, presence 55% according to PHPP specification
7 Cold water
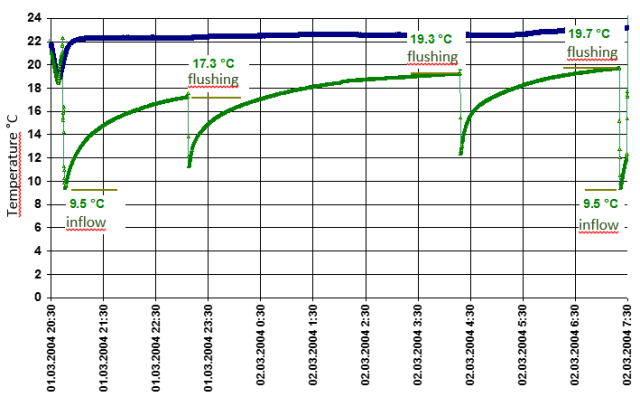
The cold water used inside the building absorbs heat from the indoor space because it remains in the pipes and toilet cisterns for some time before it is actually used. In order to determine this heat extraction, the amount of cold water used must first be ascertained. In Europe the total water consumption of households and small consumers is 110 l/person/d on average [Schnieders 2014]. Domestic rain water utilisation has not been included in this, but that will be disregarded here. 70 l/person/d will remain after the deduction of 35 l/person/d of hot water at a temperature of 45 °C (cold water is sometimes used for mixing, but for showering and taking baths at least this will not be significantly heated up by the indoor space because only a small proportion of this remains in the pipes for a longer period of time) and 5 l/person/d for external applications (garden, washing cars etc.). If one considers that drawing of cold water and flushing of toilets in particular take place in quick succession in the morning and in the evening, then it can be conservatively concluded from Figure 5 that this cold water warms up by ca. 50 % of the difference between the cold water temperature and indoor temperature before being used (in the example this would be from 9.5 °C to 16 °C at an indoor temperature of 22 °C). For Germany this results in heat removal with a constant output of 20 W per person on average.
8 Hot water
A reference hot water system which is suitable for an apartment block is assumed (see also Section 6). Smaller storage tanks are usually present in small buildings, this means higher storage losses per person, but in return hot water circulation is often not necessary here. These effects compensate each other approximately, therefore a separate investigation will not be carried out for small single-family houses.
8.1 Circulation
Circulation pipes lead into each apartment, and further distribution within the apartment itself takes place via branch lines. One metre of circulating pipe per 10 m² of living space should suffice if the taps are favourably positioned (including return flow). The linear heat loss coefficient Ψ is 0.14 W/(mK), this can be easily achieved if executed well (insulation 2 diameters, insulated fittings and clamps) and makes good economic sense.
8.2 Branch lines
The branch lines in each apartment are 20 m long and have a pipe diameter (external) of 16 mm. They contain 2 l water; the requirements for protection against legionella are met. As is standard in the PHPP, 3 tap drawings per person per day are assumed for each tap.
8.3 Storage tank
2 W/K per 1000 litres of storage volume will suffice for large hot water storage tanks if these are of a good quality and are correctly installed; this means 80 W heat losses at a storage temperature of 60 °C. Thus, storage losses will be 8 W per person if a storage volume of 100 litres is available per person (future utilisation of inexpensive solar power!).
9 Evaporation
The standard value in the PHPP for evaporation from towels, indoor plants, wet clothes etc. is -25 W per person. This equates to an amount of water of 0.85 l per person per day. This value was not changed.
10 Dependence on country
Average IHG may differ from country to country for various reasons. Possible influencing factors will be discussed briefly in this section.
10.1 Occupancy density
In many countries with a lower per capita income, occupancy density is higher than it is in Germany (see also [Grant 2014a]). However, this only has a limited influence on dissipated heat. In a comparison of 10 European countries in [Schnieders 2014], which also included some in Eastern Europe, there was no correlation between the average living area per person and the electricity consumption per square metre (r² < 0.1).
In the model, heat dissipation from household appliances does not change with higher or lower average occupancy densities in a country. The heat losses from the hot water circulation pipes are not dependent on the number of occupants. In principle, although the losses from single pipes and the storage tank are dependent on the number of occupants, this is complicated: if several persons draw water from a single pipe in quick succession, then the losses of the single pipe will hardly increase. In practice, the heat losses from the hot water storage tanks depend not on the size of the storage tank, but rather on the other parameters such as the formation of connections and the base of the storage tank. In practice, the influence of the country-specific average occupancy densities on the heat dissipation of the hot water system can therefore be disregarded. The economic development in the EU will have an equalising effect in the long term, and the demographic trend leading to lower occupancy densities everywhere will additionally contribute to the elimination of small differences gradually.
In contrast, the body heat of the people themselves will be proportional to the number of persons; only their presence represents an uncertainty factor here, which will tend to be lower in homes with higher occupancy densities, but this is also subject to cultural and climatic influences. For the time being, different country-specific occupancy densities will not be taken into account in the PHPP. However, future adjustment is conceivable for occupancy densities which differ considerably from the values for Central Europe (30-50 m² per person).
10.2 Cold water temperature
The different cold water temperatures depending on the climate result in significant differences in the losses of cold water. Nevertheless, cold water losses only constitute about 20 % of the IHG, therefore in order to keep the procedure simple, their dependence on the location is not taken into account in the overall approaches.
11 Outcome: PHPP 9 approach for IHG depending on dwelling size
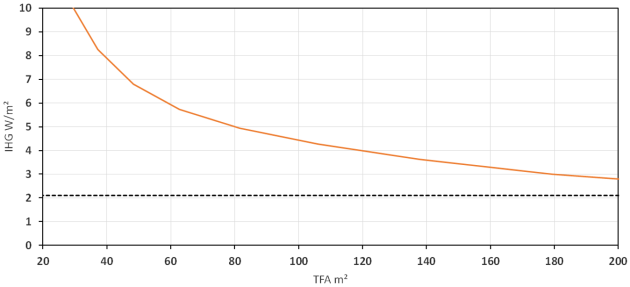
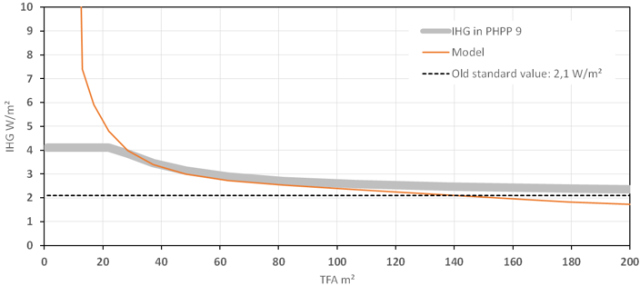
The in principle proven standard approach of 2.1 W/m² for IHG in winter has been modified based on the model described above: the standard value varies in dependence on the average living area per dwelling unit according to the grey line in Figure 6. This line follows the function
\begin{eqnarray*} & & IWQ=2,1 \frac{W}{m^2}+\frac{50}{A_{WE}} \; \end{eqnarray*}
It is slightly flatter than the IHG calculated in accordance with the model described above (orange coloured line in Figure 6). IHG that are higher than the standard PHPP value of 4.1 W/m² for homes, as would result for dwelling units with a living area of less than 25 m², are not taken into account. Whether the assumptions made for such small dwellings are still correct requires more closer examination (Are all the usual household appliances present and are they within the thermal envelope? Is the presence of occupants similar to that in larger dwelling units? Does calculation of the hot water losses still make sense?).
In order to keep the procedure as simple as possible, there are no further modifications. In view of the high variability of the values in individual cases, only a spurious accuracy would be produced in any case.
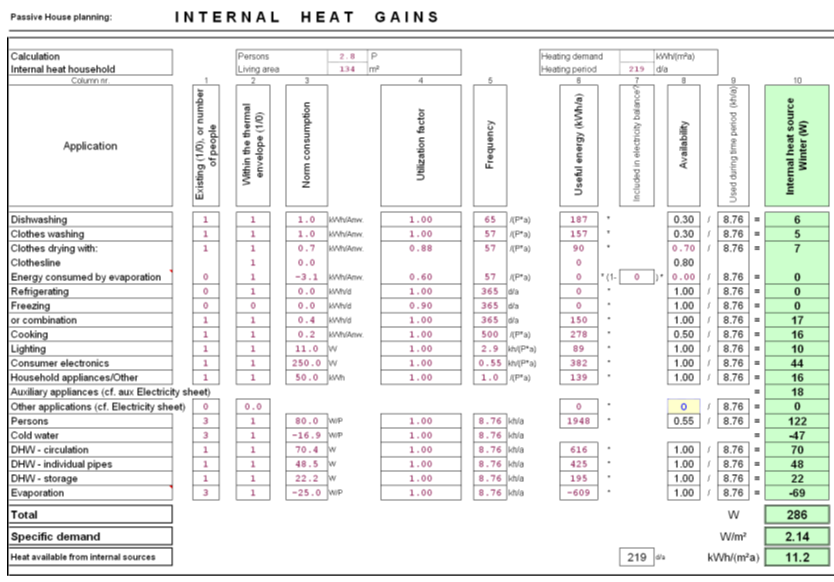
The calculation approaches and scale of the individual contributions have been summarised in Figure 7, again using the example of a dwelling unit with a living area of 134 m².
| The sole responsibility for the content of Passipedia lies with the authors. While certain marked articles have been created with the support of the EU, they do not necessarily reflect the opinion of the European Union; Neither the EACI nor the European Commission are responsible for any use that may be made of the information contained therein. |
12 References
[Ecotopten 2014] http://ecotopten.de, accessed 18.7.2014
[EEA 2015] European Environment Agency, Trends in appliance energy efficiency and ownership in households, EU-27, www.eea.europa.eu/data-and-maps/figures/trends-in-energy-efficiency-and-1, accessed 1.6.2015
[Grant 2014] Grant, Nick und Alan Clark: Internal heat gain assumptions in PHPP, 18th International Passive House Conference, Aachen, Passive House Institute; Darmstadt 2014.
[Grant 2014a] Grant, Nick und Alan Clark: Internal gain assumptions and building size, PPT file for the 18th International Passive House Conference, Aachen.
[NRW 2011] http://www.energieagentur.nrw.de/_database/_data/datainfopool/erhebung_wo_bleibt_der_strom.pdf, accessed 19.9.14
[Schnieders 2014] Schnieders, Jürgen: Boundary conditions for energy balance calculation, PassREg Deliverable D5.3.2
[Spargeräte 2014] http://www.spargeraete.de, accessed 18.7.2014
[Zensus 2011] Census database of the Census 2011, here relating to occupancy density, https://ergebnisse.zensus2011.de/#dynTable:statUnit=WOHNUNG;absRel=ANZAHL;ags=00;agsAxis=X;yAxis=HHGROESS_KLASS,WOHNFLAECHE_20S, accessed 18.7.2014
Energy labels mentioned in the article refer to the EU labels applicable before 01 March 2021.


