Table of Contents
Internal heat capacity
The article on thermal protection vs. thermal storage, explains how the overall (effective) internal heat capacity of a building influences the temperature processes in rooms. This influence will be explained in detail in the present article.
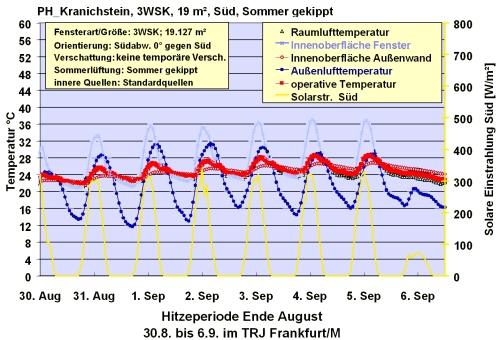
The influences of parameters which have a dynamic effect, like the heat capacity, can only be observed with non-stationary processes and only using procedures which accurately calculate instationary processes based on the laws of physics. The DYNBIL simulation software is a validated program for dealing with thermally instationary processes in buildings. A comparison of measured results from buildings and the calculations carried out using DYNBIL has been published in [AkkP-05] and presented in parts in the article about dynamic simulation. Here information can also be found about achieving reliable results using such highly complex simulation programmes. This is only possible if all other boundary conditions and influencing parameters that are not being investigated are kept to be identical; they must also represent realistic operating conditions in the building. At the same time, this implies that the simulation is based on the whole building, the course of a whole year (based on a reference year), as well as realistic user behaviour.1) Such software allows, for example, the temperature courses for a predefined building model during hot spells in summer to be simulated. The following illustration shows the result of a simulation for a living space in an end-of-terrace house.
The so-called operative temperature, which is shown in red in the illustration, is decisive for comfort. This is the mean value of the radiation and air temperature. Even during a hot spell the indoor temperatures drop to values around 24 °C due to the air exchange at night. However, during the daytime the terraced house is heated up, particularly due to solar radiation through windows. In the base case depicted, there are no temporary sunshades, and the only shading is due to the window jamb. The internal heat capacity of the building can store this solar load. The greater the effective internal heat capacity is, the less increase there is in the temperature associated with this storage process.
In the case represented here, the temperature increase between the smallest and highest daily value is not more than 4 °C. It is evident that during the hot spell it is significantly cooler in the house than the peak value of the temperature outside. The result improves if there is protection from the sunlight at the south-facing windows – but in that case the influence of the internal heat capacity cannot be clearly separated from all other effects.
In order to obtain the results given below, many simulations based on the entire year were carried out for various residential buildings with respectively controlled varying characteristics.
- In the first part, the internal heat capacity was varied,
- in the second part, the externally applied thermal protection was varied.
Each “point” in each diagram belongs to a simulation calculation that has been carried out. The simulations shown here were based on the boundary condition of residential use in the Central European climate. Furthermore, passive cooling was assumed for these examples, as appropriate under these conditions. The effect of the internal heat capacity can be different under other conditions, for example, the internal heat capacity has a higher significance in a school building due to the temporarily much increased internal loads; however the thermal insulation will still be of importance (see [AkkP-33] ). The influence of the heat capacity on the heating demand is greater in Southern Europe too, with higher solar gains and less insulation. In contrast, the heat capacity plays a less important role with active cooling and therefore largely constant temperatures in summer (see [Schnieders 2009] ).
The internal heat capacity
The influence of the internal heat capacity on the annual heating demand
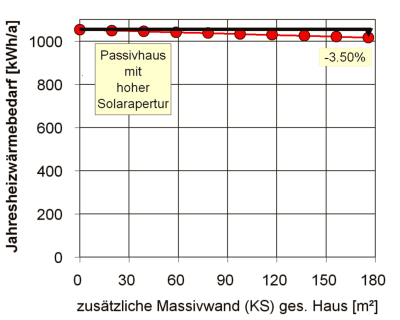 |
| Influence of the internal heat capacity. For this study additional solid interior walls were gradually built in inside the building, a maximum of 175 m² in the end (KS-solid block wall with blocks of 24 cm thickness). An increase in mass on this scale is really “solid“, this would mean a wall length of 24 m (2.5 m high) per floor. (Quelle [Feist 1993] ) |
This diagram shows that in a Passive House, energy savings definitely result if an additional effective internal storage mass is added. However, the influence is small – so small that it will hardly be noticeable (-3.5%).
- Why is the influence so small? A Passive House is only heated in the middle of winter. During this period, the external temperature is almost always considerably less than the indoor temperature and the solar gains are usually very small. The internal heat capacity cannot contribute much towards the efficient utilisation of solar energy - this is already being used to almost 100 %.
- Why is the influence so high all the same? In fact, for this building there is a certain seasonal storage effect. In the transition from autumn into winter, the house has temperatures of 22 to 23 ° C, this delays the start of the heating operation. The more heat capacity there is inside, the more pronounced this effect is.
An increase in the storage capacity is often associated with changes in the materials used. Then a higher storage capacity even results in an increase in the heating demand. The reason for this is the effect of moisture: if a material with a higher heat capacity (e.g. concrete) stores up more moisture, during the heating period with relatively dry indoor air, more moisture will be released from it. More energy will be required for this, which will be more than the amount saved by the increased storage capacity.
The influence of the internal heat capacity on the summer comfort
An important boundary condition for a realistic simulation result is that the windows in this building can be tilted open in the summer whenever required. The influence of window opening is much greater than the influence of the internal heat capacity. This is why the PHI always recommends openable windows in each room of a Passive House (see Opening windows in the Passive House?).
The illustration below shows the following:
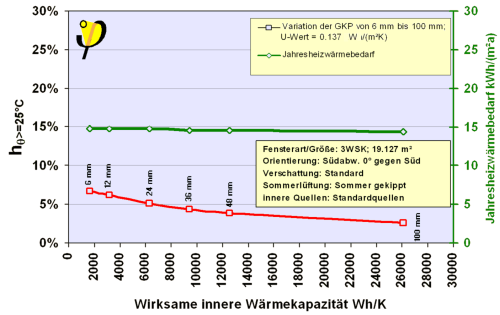
- The frequency of overheating events (left axis, red curve) as a percentage of the hours in a year in which the operative temperature exceeds 25 °C. This is a measure of the “discomfort” or more correctly, the length of the periods in which comfort does not prevail.
- The annual heating demand (right axis, green curve). This hardly varies and is nothing new; it confirms the result already obtained above.
 |
| Influence of the internal heat capacity on the comfort in a residential building
in the summer (from [Feist 1998] ). For this study, thicker gypsum boards were gra- dually added (in several layers) to a very lightweight construction (only 6 mm plasterboard all around on the walls of the lightweight construction). |
The illustration indicates that the frequency of overheating events decreases significantly as the storage mass accessible from the room is increased, assuming a small internal heat capacity to begin with. The simulation gave the same result for passive cooling in other European climates too. Apart from that, the summer case study mentioned here also revealed improved levels of comfort, irrespective of the ventilation strategy used. Of course, in summer the indoor climate in a well-ventilated room is better than that in a room with a lower air exchange. Although the internal heat capacity plays a less significant role than the air exchange, it does make a difference after all.
Note: in the Summer Sheet of the Passive House Planning Package (PHPP) all influences affecting summer comfort have been included. Optimisation of summer ventilation, shading, internal heat capacity etc. is possible using this tool.
Thermal insulation
The influence of thermal insulation of the building envelope on the annual heat demand
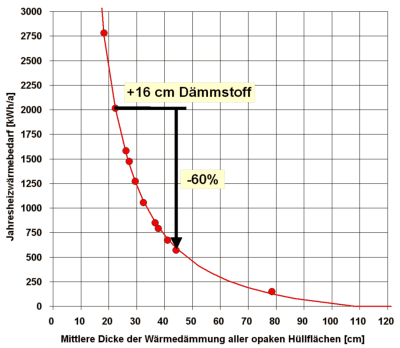 |
| Influence of the thermal insulation of the opaque components of the building envelope (roof, external wall, and basement ceiling). For this study, an additional layer of insulation was applied to the external envelope. The heating demand depending on the overall average thickness of insulation is shown. Of course, a value of “80 cm” for the total thickness is not practical - but the simula- tion shows what results this would have. A realistic increase of the insulation thickness by 16 cm from 22.5 cm to 38.5 cm has been highlighted (that is the volume of insulation which is not equivalent to the increase in the brickwork in the first example. (Source [Feist 1993] ) |
The diagram shows that better insulation has a great influence in the Passive House too. Due to the increase in insulation thickness as indicated, energy savings of around 60 % can be achieved (from about 13 kWh/m²a down to only 5 kWh/(m²a)).
- Why is the influence still so great? It is a widely held view that insulation that is “even thicker” than the good insulation already present initially serves no purpose, (because the insulation does not have any effect on other heat losses which predominate). This view is incorrect, as proven by the analysis shown. The reason for this is that in the energy balance of a Passive House, it is actually the transmission heat losses that are still dominant or recurrently predominant – ventilation heat losses are very small due to the heat recovery; and the losses through windows are over compensated by their solar gains.
- Why don’t we recommend even better insulation in spite of this? It is not worthwhile to increase the level of insulation above that which is necessary for achieving the Passive House Standard. Although thicker insulation continues to save additional heating energy (even down to zero, if insulated thickly enough), saving from 2007 kWh/a to 791 kWh/a only “gives” savings of 100 €/a. In contrast, the insulation previously invested in for achieving the Passive House Standard does not only save heating costs, but also reduces the technical expenditure for building services.
The influence of the thermal insulation on summer comfort
In the illustration below, the following is presented:
- The frequency of overheating events (left axis, red curve) as a percentage of the hours in a year on which the operative temperature exceeds 25 °C. This is a measure of the “discomfort” or more correctly, the length of the periods in which comfort does not prevail.
- The annual heating demand (right axis, green curve). This varies almost in line with the U-value, and is nothing new, it confirms the result already obtained in the last section.
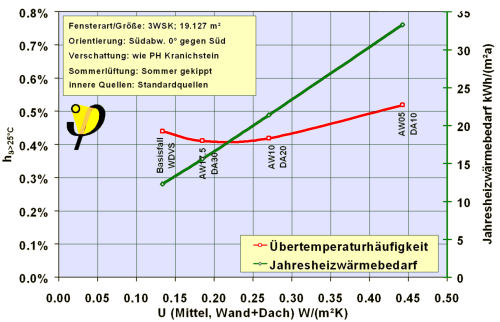 |
| Influence of the thermal insulation on the comfort of a residential building in summer (from [Feist 1998] ). For this study, the average U-value of a solid construction was varied in the range between that of a low energy house and a Passive House. |
The illustration shows that based on the given boundary conditions(residential use, windows tilted open as needed, solid construction), temperatures rarely exceed 25 °C (less than 44 h). The dependence on the thermal insulation of the building envelope is not very pronounced: poor thermal protection tends to be less favourable than good insulation.
Conclusion
The internal storage capacity of a residential building in the Central European climate only has a small influence on the annual heating demand. However, it has a balancing effect on temperature fluctuations and can therefore improve comfort in winter, too. At all events, it is advantageous to increase the internal heat capacity that is accessible from the room to sufficiently high values in order to achieve comfort in summer.
However, the internal heat capacity is not the most important influencing parameter for summer comfort.
- Possibilities for increased ventilation,
- shading from high solar gains
- and restriction of internal heat loads
are the more important parameters. For example, even a very large internal heat capacity cannot compensate for a lack of shading for large glazing areas in summer.
Literature
[AkkP-05] Energiebilanz und Temperaturverhalten; Protokollband Nr. 5 des Arbeitskreises kostengünstige Passivhäuser Phase II; Passivhaus Institut; Darmstadt 1997 Link to PHI publications
(Energy Balance and Temperature Characteristics; Protocol Volume No. 5 of the Research Group for Cost-effcient Passive Houses Phase II; Passive House Institute, Darmstadt 1997)
[AkkP-33] Passivhaus-Schulen; Protokollband Nr. 33 des Arbeitskreises kostengünstige Passivhäuser Phase III; Passivhaus Institut; Darmstadt 2006 Link to PHI Publication
(Passive House Schools, Protocol Volume No. 33 of the Research Group for Cost-efficient Passive Houses Phase III; Passive House Institute, Darmstadt 2006)
[Feist 1993] Feist, Wolfgang: Passivhäuser in Mitteleuropa; Dissertation, Universität Kassel, 1993
(Passive Houses in Central Europe, Dissertation, Kassel University 1993)
[Feist 1998a] Feist, Wolfgang: Passivhaus Sommerklima-Studie; Passivhaus Institut, Darmstadt 1998 Link to PHI Publication
(Passive House Summer Climate Study, Passive House Institute, Darmstadt 1998)
[Schnieders 2009] Schnieders, Jürgen: Passive Houses in South West Europe — A quantitative investigation of some passive and active space conditioning techniques for highly energy efficient dwellings in the South West European region. 2nd ed., Passivhaus Institut, Darmstadt 2009. Available from the Link to PHI Publication.
In the standard data set of our simulation we even assume that the users will begin to tilt open the windows at temperatures as little as 1°C above the setpoint. This also has an influence on the heating energy consumption: If the residents were to allow the building to heat up on end in the summer, more heat would be stored even towards autumn and retained for the heating period.
Conclusion: even when using a very good program for a simulation, one must consider the appropriate choice of boundary conditions.

