Table of Contents
Outdoor thermography
Outdoor thermographies provide independent evidence that insulating buildings allows for considerable energy savings and increases the level of comfort.
Infrared thermography with insulation / without insulation
The infrared imaging technique or thermography (from Wikipedia) is widely used these days. The infrared range is that part of the invisible light spectrum which is adjacent to the red end of the visible light range if its wavelength is extended. Infrared thermographies of buildings are based on long-wave infrared radiation (from Wikipedia) (IR). All objects surrounding us emit thermal radiation within this wavelength range. Thermal imaging cameras can record long-wave thermal radiation and produce images which similar to photographs – the only difference being that they depict heat rays instead of visible light.
This image shows a member of the passive House Institute taking a thermal image. The camera is mounted on a stand. It produces a colour image of the infrared radiation with a wavelength between 8 and 15 µm which allows for conclusions to be drawn regarding the objects’ temperatures. This image shows a blue spot where a fresh layer of plaster has just been added below the window sill. The plaster is still wet – moisture evaporates cooling the area. This example shows that cold spots aren’t necessarily caused by thermal bridges. Preparing and evaluating IR images requires a great deal of expertise.
Applying exterior insulation
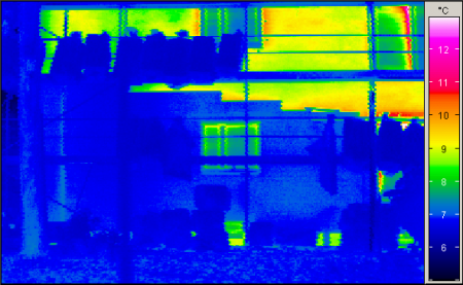
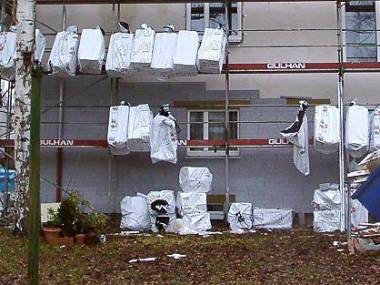
The following infrared image was taken during the application of exterior insulation to a Nuremberg building. The modernisation was planned and carried out by the architect Dr. Burkhard Schulze-Darup. The Passive House Institute provided guidance and quality assurance. This was when the images documented in this article were taken. The modernisation was planned and carried out in an exemplary way reducing the energy use for heating to less than 10% of the original figure. These values have been proven through measurements and have been published (see Refurbishment with Passive House components).
These IR images are rather revealing:
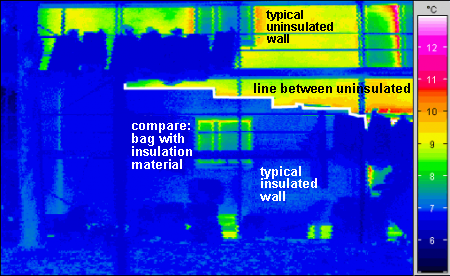
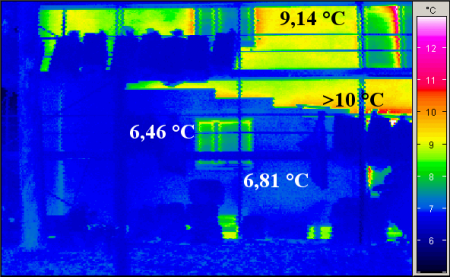
- The outdoor air temperature is approx. 6.46 °C as measured at the surface of the bags hanging from the scaffolding. The surfaces of these bags have reached a temperature equilibrium with the outdoor air; therefore they neither give off heat nor do they absorb heat.
- The temperatures measured for the areas of the facade that have already been insulated are very uniform and rather similar to that recorded for the bags – rendering the bags barely noticeable in the thermal image. Nevertheless, the insulated surface is slightly warmer than the surrounding objects. Since the thermal image was taken before sunrise, direct or indirect sunlight would not be the cause for the slightly higher temperatures of 6.81 °C on average. In fact, the temperature difference is due to small heat losses which remain even with the wall being insulated. The uniform image in the area that has already been insulated is a good sign, showing that the insulation has been properly applied.
- The facade areas of the heated upper floor which have not yet been insulated have a much higher average temperature of 9.14 °C. Moreover, their temperatures are not uniform. This is due to a number of reasons: In some areas, significant heat losses are caused by thermal bridges – e.g. at the edge of the window where the heat only travels a short distance the masonry. In other areas, furniture is positioned along the external walls serving as partial interior insulation and reducing the temperature in these areas. Incidentally, the temperature of the interior wall surface behind the furniture is also lower – which may cause severe problems (see Problems due to moisture build-up). Therefore, furniture should not be placed directly next to poorly insulated exterior walls.
- The heat emitted by an object is roughly proportional to the temperature difference between this object and the outdoor air temperature.
In this case, the difference is:
for the uninsulated wall: 9.14 – 6.46 = 2.68 degrees
for the insulated wall: 6.81 – 6.46 = 0.35 degrees
These figures allow for a rough estimation of the heat losses through the wall: those occurring at the insulated wall are reduced by a factor of 8 compared with the uninsulated wall.
The thermal image doesn't only show that the insulated facade loses less heat than the uninsulated facade. It also allows for an estimation of the difference. Unfortunately though, this method is not very accurate. Above all, we need to bear in mind that it is only a momentary “snapshot”. It only allows for reliable conclusions to be drawn if the thermal conditions have been stable over an extended period of time before the picture is taken, especially if there hasn’t been any direct sunlight heating up individual areas of the facade. The last few hours of the night are a good time for obtaining useful exposures.
The white line in the second thermography reflects the edge where the insulation ends and where the bare brick wall starts to show behind the insulation which has already been applied. Even at some distance the brick wall is losing less heat and has become somewhat warmer – reaching a temperature of over 18 °C. This is good as moisture build-up is reduced and structural damage is prevented even if furniture is placed next to the exterior wall. Increased temperatures behind the insulated wall also promote cross-heat-flow upwards through the wall. As a result, the temperature increases at the edge where the bare wall shows behind the insulation. This effect is clearly reflected in the thermal image with an orange-coloured strip running closely to the edge of the insulation. As the image is taken from an upward angle the brick wall is somewhat covered by the front edge of the insulation; otherwise the effect would be even more obvious.
The complete insulation
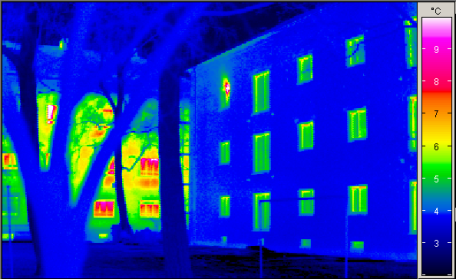
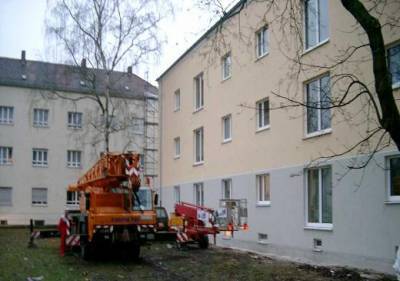
The following thermal image shows the fully insulated facade. An ordinary photograph of the same building has been added for comparison purposes.
That morning, the outdoor air temperature is approx. 3.5 degrees Celsius. The uninsulated wall of an old building is shown on the left side in the background of the thermal image (colourful). Lots of heat is conducted towards the outer surface of the wall and radiated into the surroundings. This is reflected in high surface temperatures between 6 and 7 °C.
On the right side in the foreground of the image, the new insulated facade is shown in dark blue colours: the insulation considerably reduces the amount of heat flowing from the inside to the outside of the building. The new plaster surface has a uniformly low temperature of approximately 3.7 °C which is hardly any different from the temperature of the surrounding trees. This shows that the heat loss is extremely small. Higher heat losses at the windows and the colours around the tilted window (above left) prove that the house is indeed heated.
Note on the tilted window
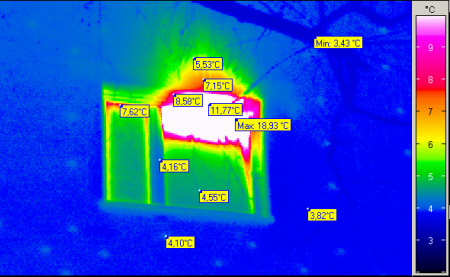
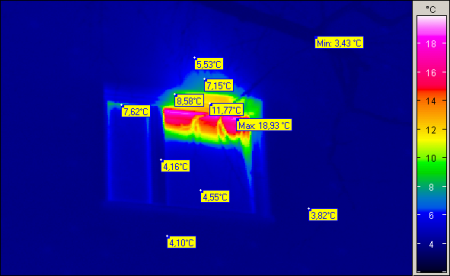
The following images illustrate the thermal effects around the tilted window in this building. They are both the same image, displaying different temperature ranges:
- The image on the left only shows temperatures between 2 and 10 degrees Celsius, higher temperatures are displayed as white areas.
- The image on the right shows temperatures between 2 and 20 degrees Celsius revealing the tilted window as well as the window sill (light purple). The temperature at the interior surface is close to 19°C.
This example illustrates just how well the insulation works: Even with the window open, the interior surface of the wall stays warm even right next to the thermal bridge due to the window installation.
What about tilting a window in a Passive House? Well, it's possible, as the pictures show. Does it change the Passive Houses performance? Not so much, as long as the window is no opened for a long time - see for more information the following Passipedia article: User window opening.
Conclusion
The analyses presented in this article highlight that improved insulation works and that it considerably reduces heat losses, and that the generally accepted scentific calculation methods apply.


